 For multi-academy trusts
Complete trust-wide school improvement software to plan, monitor and evaluate performance with confidence.
Explore SchooliP →
For multi-academy trusts
Complete trust-wide school improvement software to plan, monitor and evaluate performance with confidence.
Explore SchooliP →
For multi-academy trusts
Complete trust-wide school improvement software to plan, monitor and evaluate performance with confidence.
Explore SchooliP →
For multi-academy trusts
Complete trust-wide school improvement software to plan, monitor and evaluate performance with confidence.
Explore SchooliP →
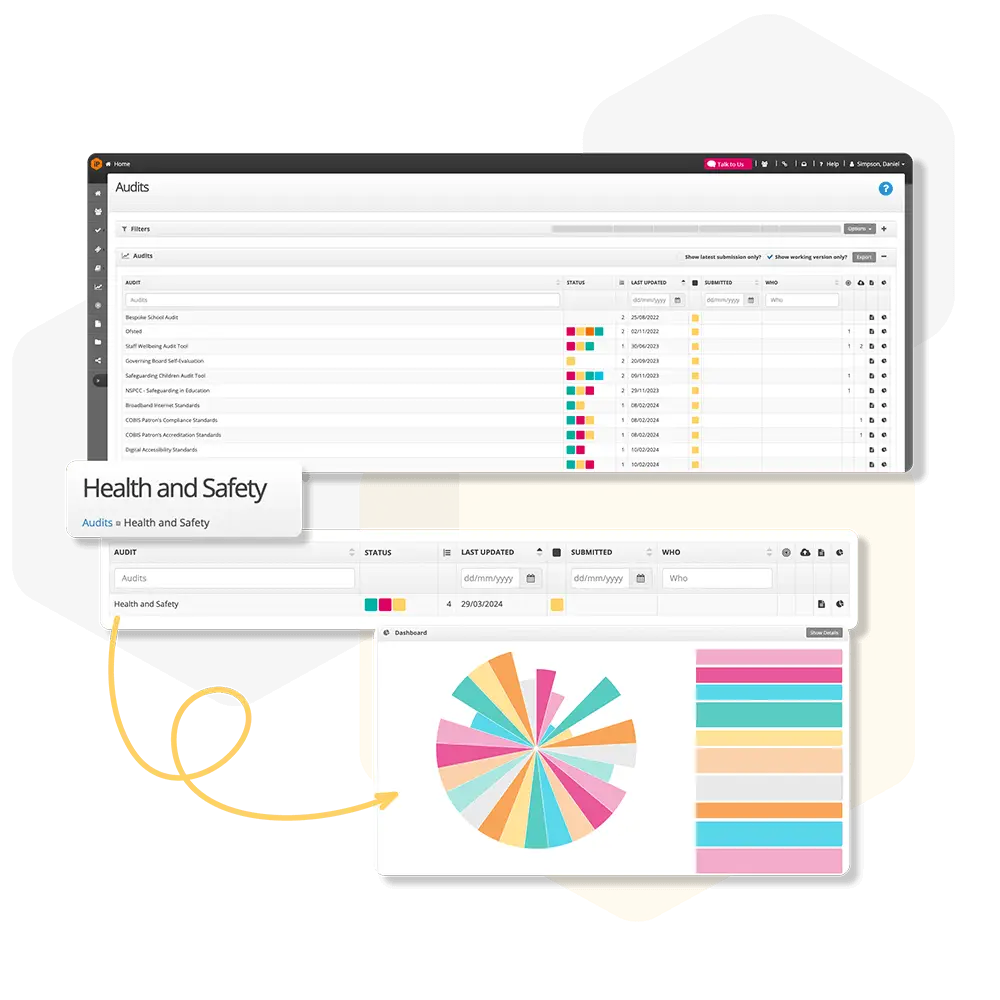
Each audit has it's own personal dashboard, to view go to audits and click on the pie chart icon near the audit you wish to view
The dashboard provides an overview of each question within the audit. Scoring questions allows you to access detailed data and track progress more effectively.
Click Show Details to view each section in more detail.
This allows you to quickly see how each section has been rated.
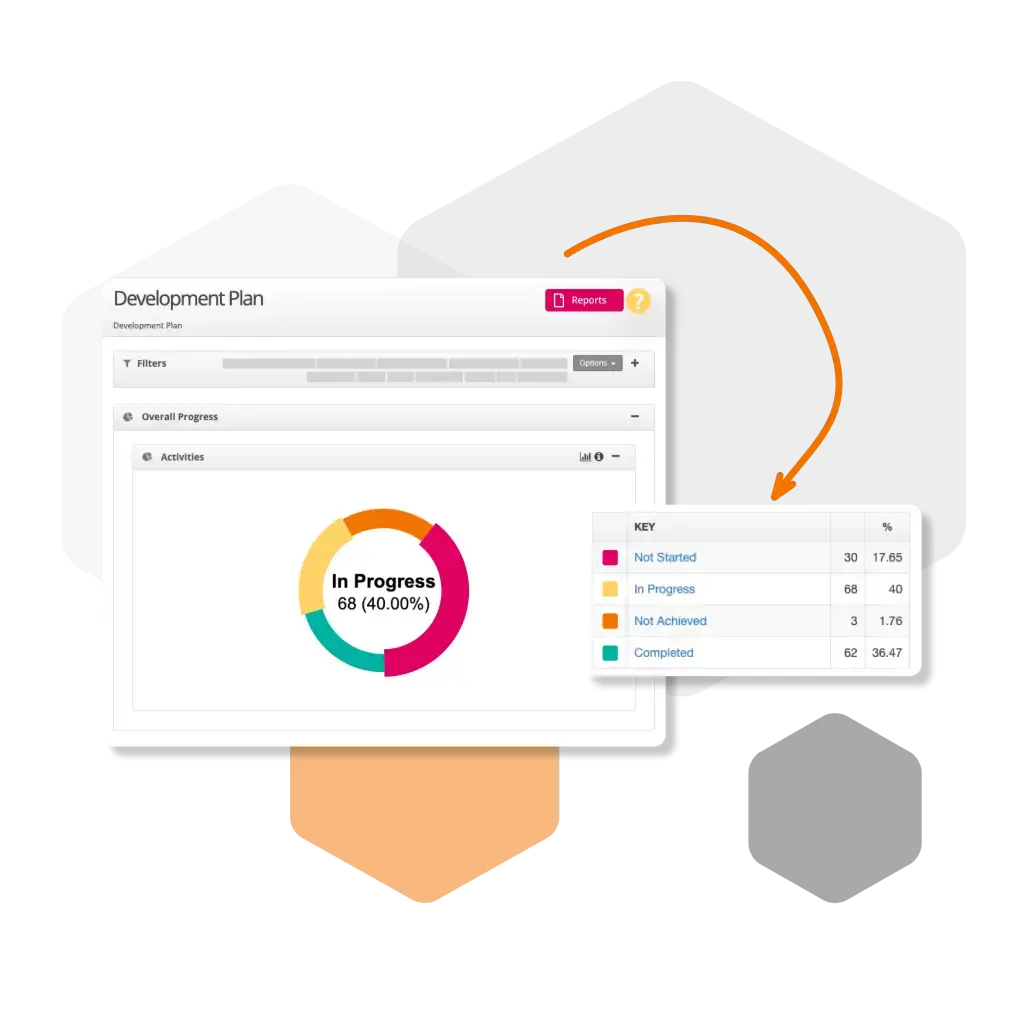
A graph is displayed for each section, which can be shown as a pie chart or bar chart.
Click the “i” icon to view the key.
The key explains how each question in the section has been rated.
This helps you easily monitor progress and identify areas for improvement within the audit.